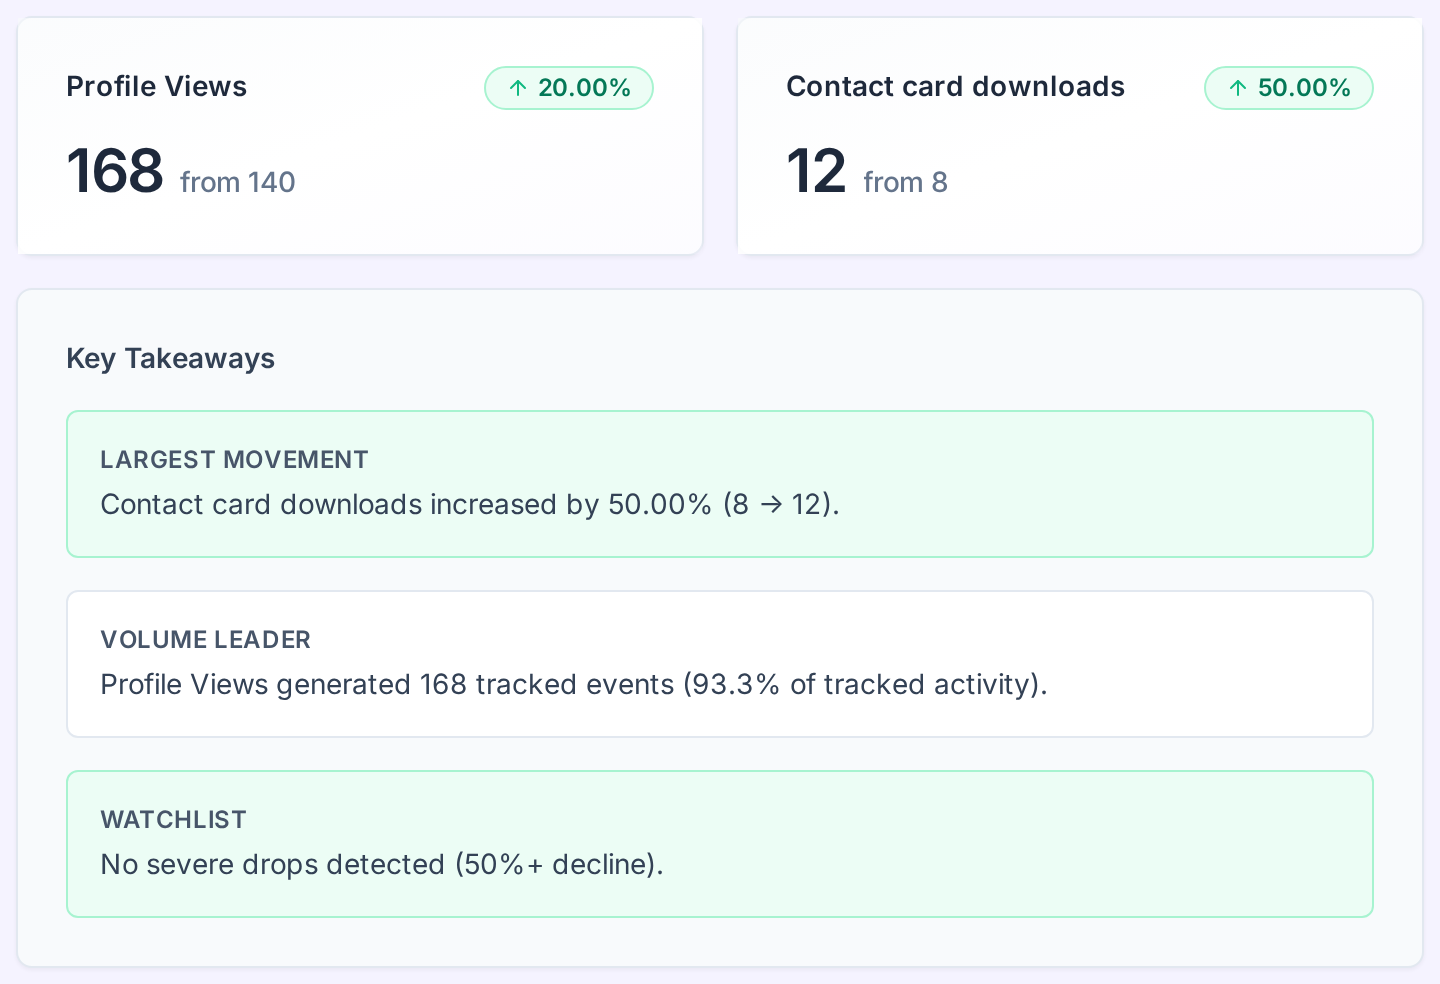
You paid for cards, flyers or a counter sign. Now you need to know whether people use them and what happens next. Tracking QR code scans helps you decide what to improve, where to keep distributing, and which ideas deserve another test.
If you searched for “who scans my QR code,” start with an important limit: a scan does not reveal a person's name or email. QRown Statistics shows recorded activity and trends. A visitor becomes someone you can contact when they choose to share their details, for example through a lead form.
Track the question behind the print spend
Choose a business question before comparing numbers. “Are people scanning our reception sign?” needs a different test from “Does this flyer bring enquiries?”
- QR scans: Is the printed invitation getting a response?
- Profile views: Is the destination receiving visits, including visits through other channels?
- Contact and link actions: What are visitors trying to do on the page?
- Contact-card downloads: Are people requesting a copy of your details?
- Lead submissions: Are visitors actively asking you to follow up?
A click on a booking link is not a confirmed appointment. A download is not a confirmed saved contact. Check bookings and sales in the systems that actually complete those actions.
Give each placement a separate source
If the same QR image is printed on both a window sign and a flyer, its scan total cannot tell you which object was scanned. To compare placements, use separate QR codes and label them clearly, such as “Front window” and “Market flyer.” Additional QR-code allowances depend on your plan.
QRown records QR sources by their code identity. Print Studio designs also have their own QR identities, grouped by product type in reporting. Printing two copies of one design does not create two independently measurable locations.
- Choose two placements you can compare fairly and create a separate code for each.
- Keep the offer and destination consistent while testing the placement.
- Record the distribution dates, quantities and costs in your own campaign notes.
- Review the same date range in Statistics and compare the recorded sources.
Approximate location data is context, not proof of a particular shop, shelf or street. Use separate sources for that distinction.
Turn the pattern into the next test
- Few scans: Check visibility, lighting, code readability and whether the printed invitation gives a reason to scan.
- Visits but little action: Make the promised information easy to find. Move the relevant contact or link action higher.
- Useful enquiries from one source: Review their quality and your follow-up before expanding that placement.
- More scans but no useful enquiries: The offer may attract curiosity without the kind of interest you need.
Compare similar periods and exposure. A flyer distributed widely may produce more scans than a small sign without being the better investment. Scan totals alone do not supply a response rate; you need a meaningful distribution or exposure estimate too.
See what preceded an enquiry
A lead form gives visitors a way to tell you what they need. In the Leads Inbox, Lead Story can show recorded context associated with a submission, such as the arrival source and activity in its session.
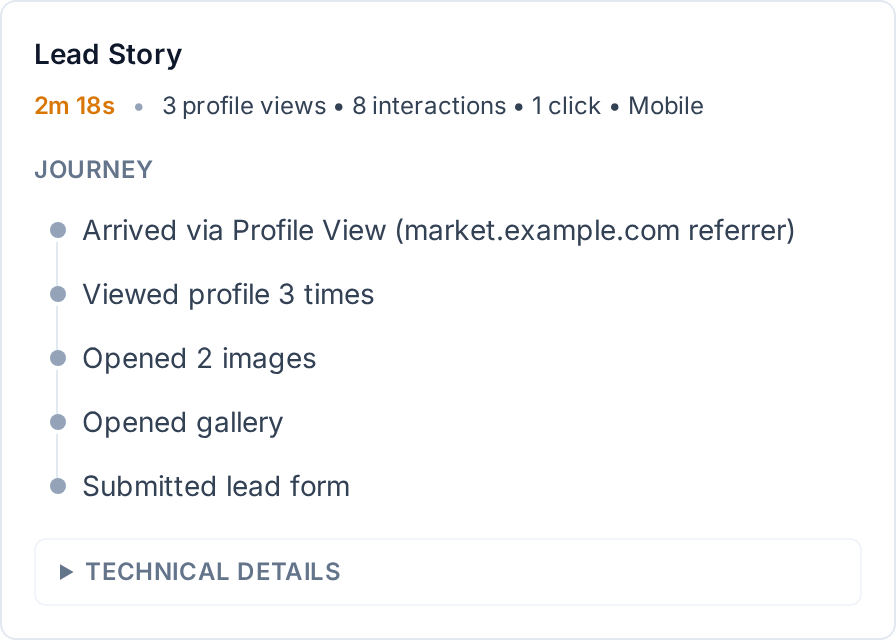
Read that context alongside what the person actually submitted. Add your notes, respond through your email app where available, and update the lead's status as you follow up. Available lead fields, submission visibility and follow-up features vary by plan.
Know what the data leaves out
Repeat activity can come from the same person. Owner and authorized team self-interactions are suppressed, so your own testing may not appear in Statistics. Device, session and source information can be incomplete. Treat the report as recorded evidence, not a complete count of people exposed to your material.
The main profile QR always opens your QRown profile. Additional codes can send people to an external destination; QRown can record that redirect scan, but it does not thereby measure everything that happens on the external site. Changing a destination also does not turn Statistics into a report of historical destination versions.
Google Analytics and Microsoft Clarity are separate Business integrations. Start with a question the built-in Statistics can answer before adding another tool.
Need a practical experiment? Start with these QR marketing ideas.